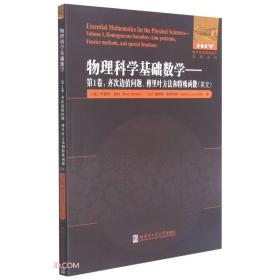
贸易与经济中的应用统计学(第6版)
正版 贸易与经济中的应用统计学(第6版)(英文)
¥ 23.2 4.0折 ¥ 58 全新
库存17件
北京房山
认证卖家担保交易快速发货售后保障
作者[美]大卫·P.多恩(David P.Doane) 著
出版社哈尔滨工业大学出版社
出版时间2019-06
版次1
装帧平装
货号E
上书时间2024-09-06
- 店主推荐
- 最新上架
商品详情
- 品相描述:全新
- 正版库存书 非二手
- 商品描述
- E31-05
图书标准信息
- 作者 [美]大卫·P.多恩(David P.Doane) 著
- 出版社 哈尔滨工业大学出版社
- 出版时间 2019-06
- 版次 1
- ISBN 9787560366586
- 定价 58.00元
- 装帧 平装
- 开本 16开
- 纸张 胶版纸
- 页数 846页
- 字数 2093千字
- 【内容简介】
-
¡¡¡¡As recently as a decade ago our students used to ask us£¬ \"How do I use statistics? Today we more often hear£¬ \"Why should I use statistics?\" Applied Statistics in Business and Economics has attempted to provide real meaning to the use of statistics in our world by using real business situations and real data and appealing to your need to know why rather than just how.
¡¡¡¡With over 50 years of teaching statistics between the two of us£¬ we feel we have something to offer. Seeing how students have changed as the new century unfolds has required us to adapt and seek out better ways of instruction. So we wrote Applied Statistics in Business and Economics to meet four distinct objectives.
¡¡¡¡Objective 1£º Communicate the Metuung of Variation in a Business Context Variation exists everywhere in the world around us. Successful businesses know how to measure variation. They also know how to tell when variation should be responded to and when it should be left alone. We\'ll show how businesses do this.
¡¡¡¡Objective 2£º Use Real Data and Real Business Applications Examples£¬ case studies£¬ and problems are taken from published research or real applications whenever possible. Hypothetical data are used when it seems the best way to illustrate a concept. You can usually tell the difference by examining the footnotes citing the source.
¡¡¡¡Objective 3£ºIncorporate Current Statistical Practices and Offer Practical Advice With the increased reliance on computers£¬ statistics practitioners have changed the way they use statistical tools. We\'ll show the current practices and explain why they are used the way they are. We also will tell you when each technique should not be used.
¡¡¡¡Objective 4£º Provide More In-Depth Explanation of the Why and Let the Software Take Care of the How It is critical to understand the importance of communicating with data. Today\'s computer capabilities make it much easier to summarize and display data than ever before. We demonstrate easily mastered software techniques using the common software available. We also spend a great deal of time on the idea that there are risks in decision making and those risks should be quantified and directly considered in every business decision.
¡¡¡¡Our experience tells us that students want to be given credit for the experience they bring to the college classroom£¬ We have tried to honor this by choosing examples and exercises set in situations that will draw on students\' already vast knowledge of the world and knowledge gained from other classes£¬ Emphasis is on thinking about data£¬ choosing appropriate analytic tools£¬ using computers effectively£¬ and recognizing limitations of statistics. - 【作者简介】
-
:
大卫·P.多恩,David P. Doane is accredited by the American Statistical Association as a Professional Statisti-cian (PStat) . He is professor emeritus in Oakland University‘s Department of Decision andInformation Sciences. He earned his Bachelor of Arts degree in mathematics and economicsat the University of Kansas and his PhD from Purdue University‘s Krannert Graduate School.His research and teaching interests include applied statistics, forecasting, and statistical educa-tion. He is co-recipient of three National Science Foundation grants to develop software toteach statistics and to create a computer classroom. He is a longtime member of the AmericanStatistical Association, serving in 2002 as president of the Detroit ASA. He has consulted withgovernment, health care organizations, and local firms. He has published articles in manyacademic journals. He currently belongs to ASA chapters in San Diego and Orange County/Long Beach.
- 【目录】
-
CHAPTER ONE
Overview of Statistics
CHAPTER TWO
Data Collection
CHAPTER THREE
Describing Data Visually
CHAPTER FOUR
Descriptive Statistics
CHAPTER FIVE
Probability
CHAPTER SIX
Discrete Probability Distributions
CHAPTER SEVEN
Continuous Probability Distributions
CHAPTER EIGHT
Sampling Distributions and Estimation
CHAPTER NINE
One-Sample Hypothesis Tests
CHAPTER TEN
Two-Sample Hypothesis Tests
CHAPTER ELEVEN
Analysis of Variance
CHAPTER TWELTVE
Simple Regression
CHAPTER THIRTEEN
Multiple Regression
CHAPTER FOURTEEN
Time-Series Analysis
CHAPTER FIFTEEN
Chi-Square Tests
CHAPTER SIXTEEN
Nonparametric Tests
CHAPTER SEVENTEEN
Quality Management
APPENDIXES
A Binomial Probabilities
B Poisson Probabilities
C-1 Standard Normal Areas
C-2 Cumulative Standard Normal Distribution
D Student\'s Critical Values
E Chi-Square Critical Values
F Critical Values of F10
G Solutions to Odd-Numbered Exercises
H Answers to Exam Review Questions
I Writing and Presenting Reports
J Excel Statistical Functions
INDEX
±à¼ÊÖ¼Ç
点击展开
点击收起
— 没有更多了 —


以下为对购买帮助不大的评价